Every pipeline test passed. 70% of the calls were being dropped.
One of the pilot customers had a configuration error in their system that was dropping about 70% of their calls right after connection. Seven in ten people who dialed got nothing, and nobody had noticed. The team is a small one with a great deal else to do, nobody was sitting and watching the call records table, and nothing else in the stack was going to complain.
What noticed was a monitor that nobody had written.
The pilot has a table that records each call as a single row, and one of the columns holds the duration of that call. The dropped calls were still placed, still recorded and still written into the table as rows, but with a duration of zero seconds, which pulled the average down sharply. AIMO triggered an alert on the monitor that follows the average call duration of that table: the value had dropped below the expected range, and the alert landed the morning after the drop first reached the data. That alert started the investigation at the pilot's end that found the configuration error.
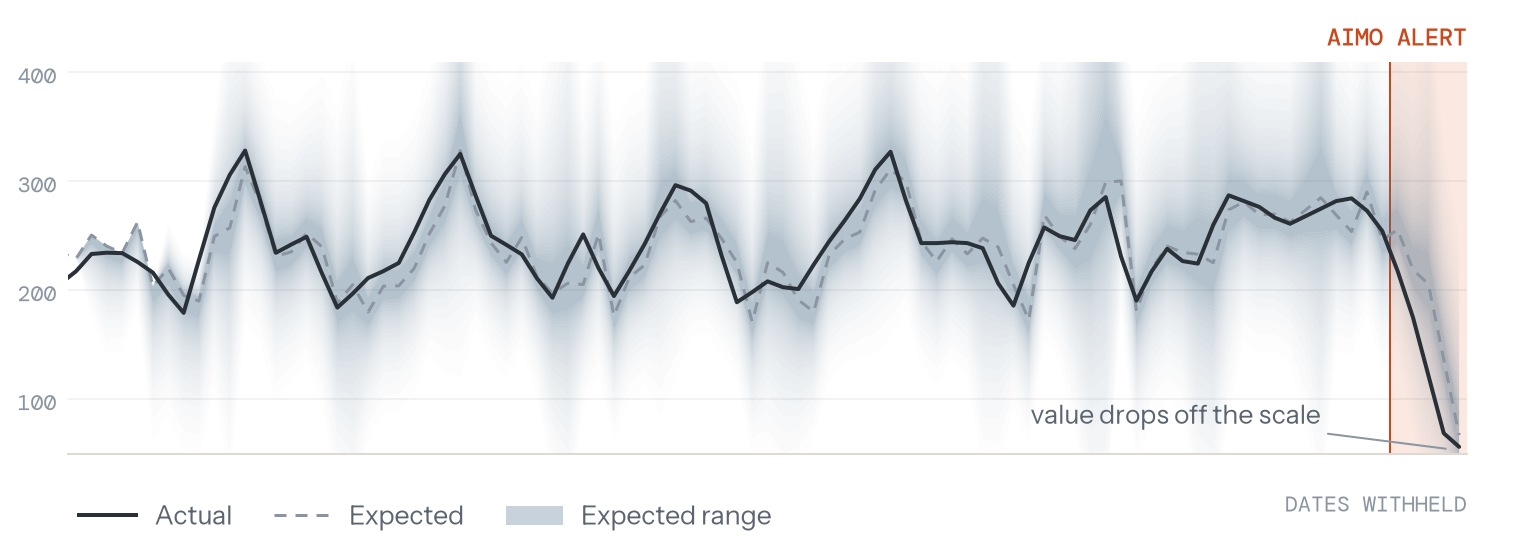
The chart is the pilot's own: their values, with the dates removed and the view stopping at the alert, as the detector reads them today.
The data pipelines worked as expected
No pipeline failed, no job errored, no schema changed and no freshness check went stale. The row count did not move significantly either, because the same number of calls was still being recorded. Every test that asks whether the data arrived correctly answered that it did, and those tests were right.
The data was arriving correctly. What changed was the process that produced the data.
Pipeline monitoring watches the pipeline, and tests assert the things that somebody thought to assert at the time of writing them, perhaps with generous bounds on a few metrics. Neither of them looks at what the numbers mean or how they evolve through time, so a process that changes shape upstream stays invisible until somebody happens to open the right chart. This is a category that most data tooling does not cover.
So AIMO detects not only data quality issues, but also critical changes in the processes that give rise to the data being measured. Note that this also changes who the alert is for. A rate of dropped calls is not a data problem, it is an operational problem that happened to become visible in the data first, and the audience for such an alert can be analytics or devops in addition to the data team.
Nobody wrote the monitor that caught this
Nobody sat down with the call records table and decided that the average call duration was a number worth following.
When AIMO was asked to analyze the table and pick monitors for it out of everything it could read from the database, it came up with 113 monitors for that 30-column table. The row count monitor is added automatically, and AIMO authored the rest itself, among them the following:
| Name | Metric |
|---|---|
| Average call duration (seconds) | AVG(duration) |
| 95th percentile call duration (seconds) | PERCENTILE_CONT(0.95) WITHIN GROUP (ORDER BY duration) |
| Call duration skew (p90/p10 ratio) | PERCENTILE_CONT(0.9) WITHIN GROUP (ORDER BY duration) / NULLIF(PERCENTILE_CONT(0.1) WITHIN GROUP (ORDER BY duration), 0) |
| Customer price spread | MAX(price) − MIN(price) |
| Functional dependency: client_id determines phone_number | COUNT(DISTINCT CONCAT(CAST(client_id AS VARCHAR), '|', phone_number)) − COUNT(DISTINCT CAST(client_id AS VARCHAR)) |
The first one is the monitor that fired. The last one is, however, the one that is most worth looking at, because it is not a metric at all but a constraint. It states that one client should map to exactly one phone number, and it counts how many times that is violated. These are the checks that every data team agrees should exist, and that very few teams ever get around to writing.
Writing 113 of them for a single table is a week of work that is never the work of this particular week.
What the expected range means
After the monitors were generated, AIMO servers tasked the AIMO agent running in the pilot customer's environment to connect to their database and calculate the full history of each monitor, day by day. AIMO detects and uses indexes, clustering or partitioning by itself, where the database offers them and the table has been configured to use them.
Once this backfill was finished, AIMO worked out, for every monitor and every day, what that day should have looked like given the monitor's own history: its level, its weekly rhythm and how it had been moving lately. That expectation is the reference, not the judge.
The judging is separate. Each day's reading is weighed against the expectation in units of how much that monitor usually moves, and days that fall outside add up until there is enough to alert on. How much is enough comes from one budget for the whole account, stated as false alerts from a healthy monitor, by default about one per monitor per year.
That number is deliberate rather than comfortable, because it is the one that has to survive being multiplied by the monitor count. With 113 monitors on a single table and one expected false alert per monitor per year, the alert budget of that table is roughly one alert every three days, and consecutive unusual days count as one episode and one alert, not an alert every morning. A monitoring system that fires ten times more often than that is not a monitoring system, it is something that people mute. This is also the reason why the drop in the chart above received attention when it arrived.
What was needed to set this up
Nothing in the case described above was configured by hand. There were no rules, no thresholds and no expectations file. The AIMO agent runs inside the environment of the customer, connects to their database, and works out the rest by itself: what is worth monitoring, how to compute it efficiently, and what normal looks like once there is enough history.
The information on how to connect to the database is stored on AIMO's servers, but it is encrypted on the agent in the client's environment with a passphrase that only the client knows, so the connection to the database can only be established at the agent. The architecture and security documentation covers this in detail, including what runs where and what our servers can and cannot see.
Once the database connection was set up, the rest took about 20 minutes: analyzing the database, generating the monitors, calculating them against the database, working out what normal looks like from the history, and surfacing the episodes already hiding in it. Most of that time went on generating the monitors with an LLM, and on the calculation itself. The calculation is the slow part, because it backfills the entire history of all 113 monitors, which means reading the table through several years back.
After that, AIMO was ready to monitor the table and alert on unexpected changes. This table's monitors were set to run once a day, which is why the alert arrived the morning after the drop rather than the same afternoon. Shorter intervals are available.
The same thing, on data that we do not control
Everything described above happened inside the private database of a customer, which means that the reader has to take my word for it. That is not a good position to argue from, so there is also a public version of the same thing.
The public demo runs the same product on messy public data, with no login and nothing staged, and it includes a defect that AIMO caught on scraped train data that can be looked at right now. The monitors there are written by AIMO in the same way, the expected ranges are computed from the history in the same way, and the alerts are produced in the same way.
If your data is produced by processes that could change shape without a single pipeline turning red, which is the case for most data, then tell us about it. We are taking pilots.