Data quality monitoring
An agent watching tables
alerts when one strays.
Your dashboards, forecasts, invoices and AI models all rest on tables that somebody hopes are still correct. Most of the time nobody is checking, because checking has always meant writing every rule by hand.
AIMO reads each table’s schema and a profile of its data, generates the monitors that fit it, and learns what normal looks like from that table’s own history. You choose the tables. It does the rest.
It is also built to stay quiet. A monitor that cries wolf gets muted, and a muted monitor looks like coverage while giving you none, so restraint is the constraint the whole detector is designed around.
And it does all of that without moving your data. The agent runs beside your databases; only aggregates and metadata ever leave.
The problem
Why data quality monitoring never gets done.
Most teams know they need it. It stays on the backlog because the traditional route asks an engineer to read every schema, talk to every stakeholder and hand-write every assertion, and the list of checks nobody got to never shrinks.
Errors travel quietly
A bad load rarely announces itself. It flows downstream, joins other tables and surfaces weeks later as a number nobody can trace back to its source.
Models learn the mistakes
An AI pipeline trained on a skewed column does not fail. It returns a confidently wrong answer, and the cause sits buried in training data nobody re-reads.
Reports lose their authority
Once a board deck has been wrong once, every figure after it gets questioned. The cost is not the single error. It is the doubt attached to every number since.
Engineers maintain the checks
Hand-written thresholds fire on every seasonal dip and sleep through real drift. Keeping them honest becomes its own job, so most tables end up with no coverage.
Each of these is the same failure in a different costume: nothing is watching the table itself, continuously, while the error is still cheap to fix.
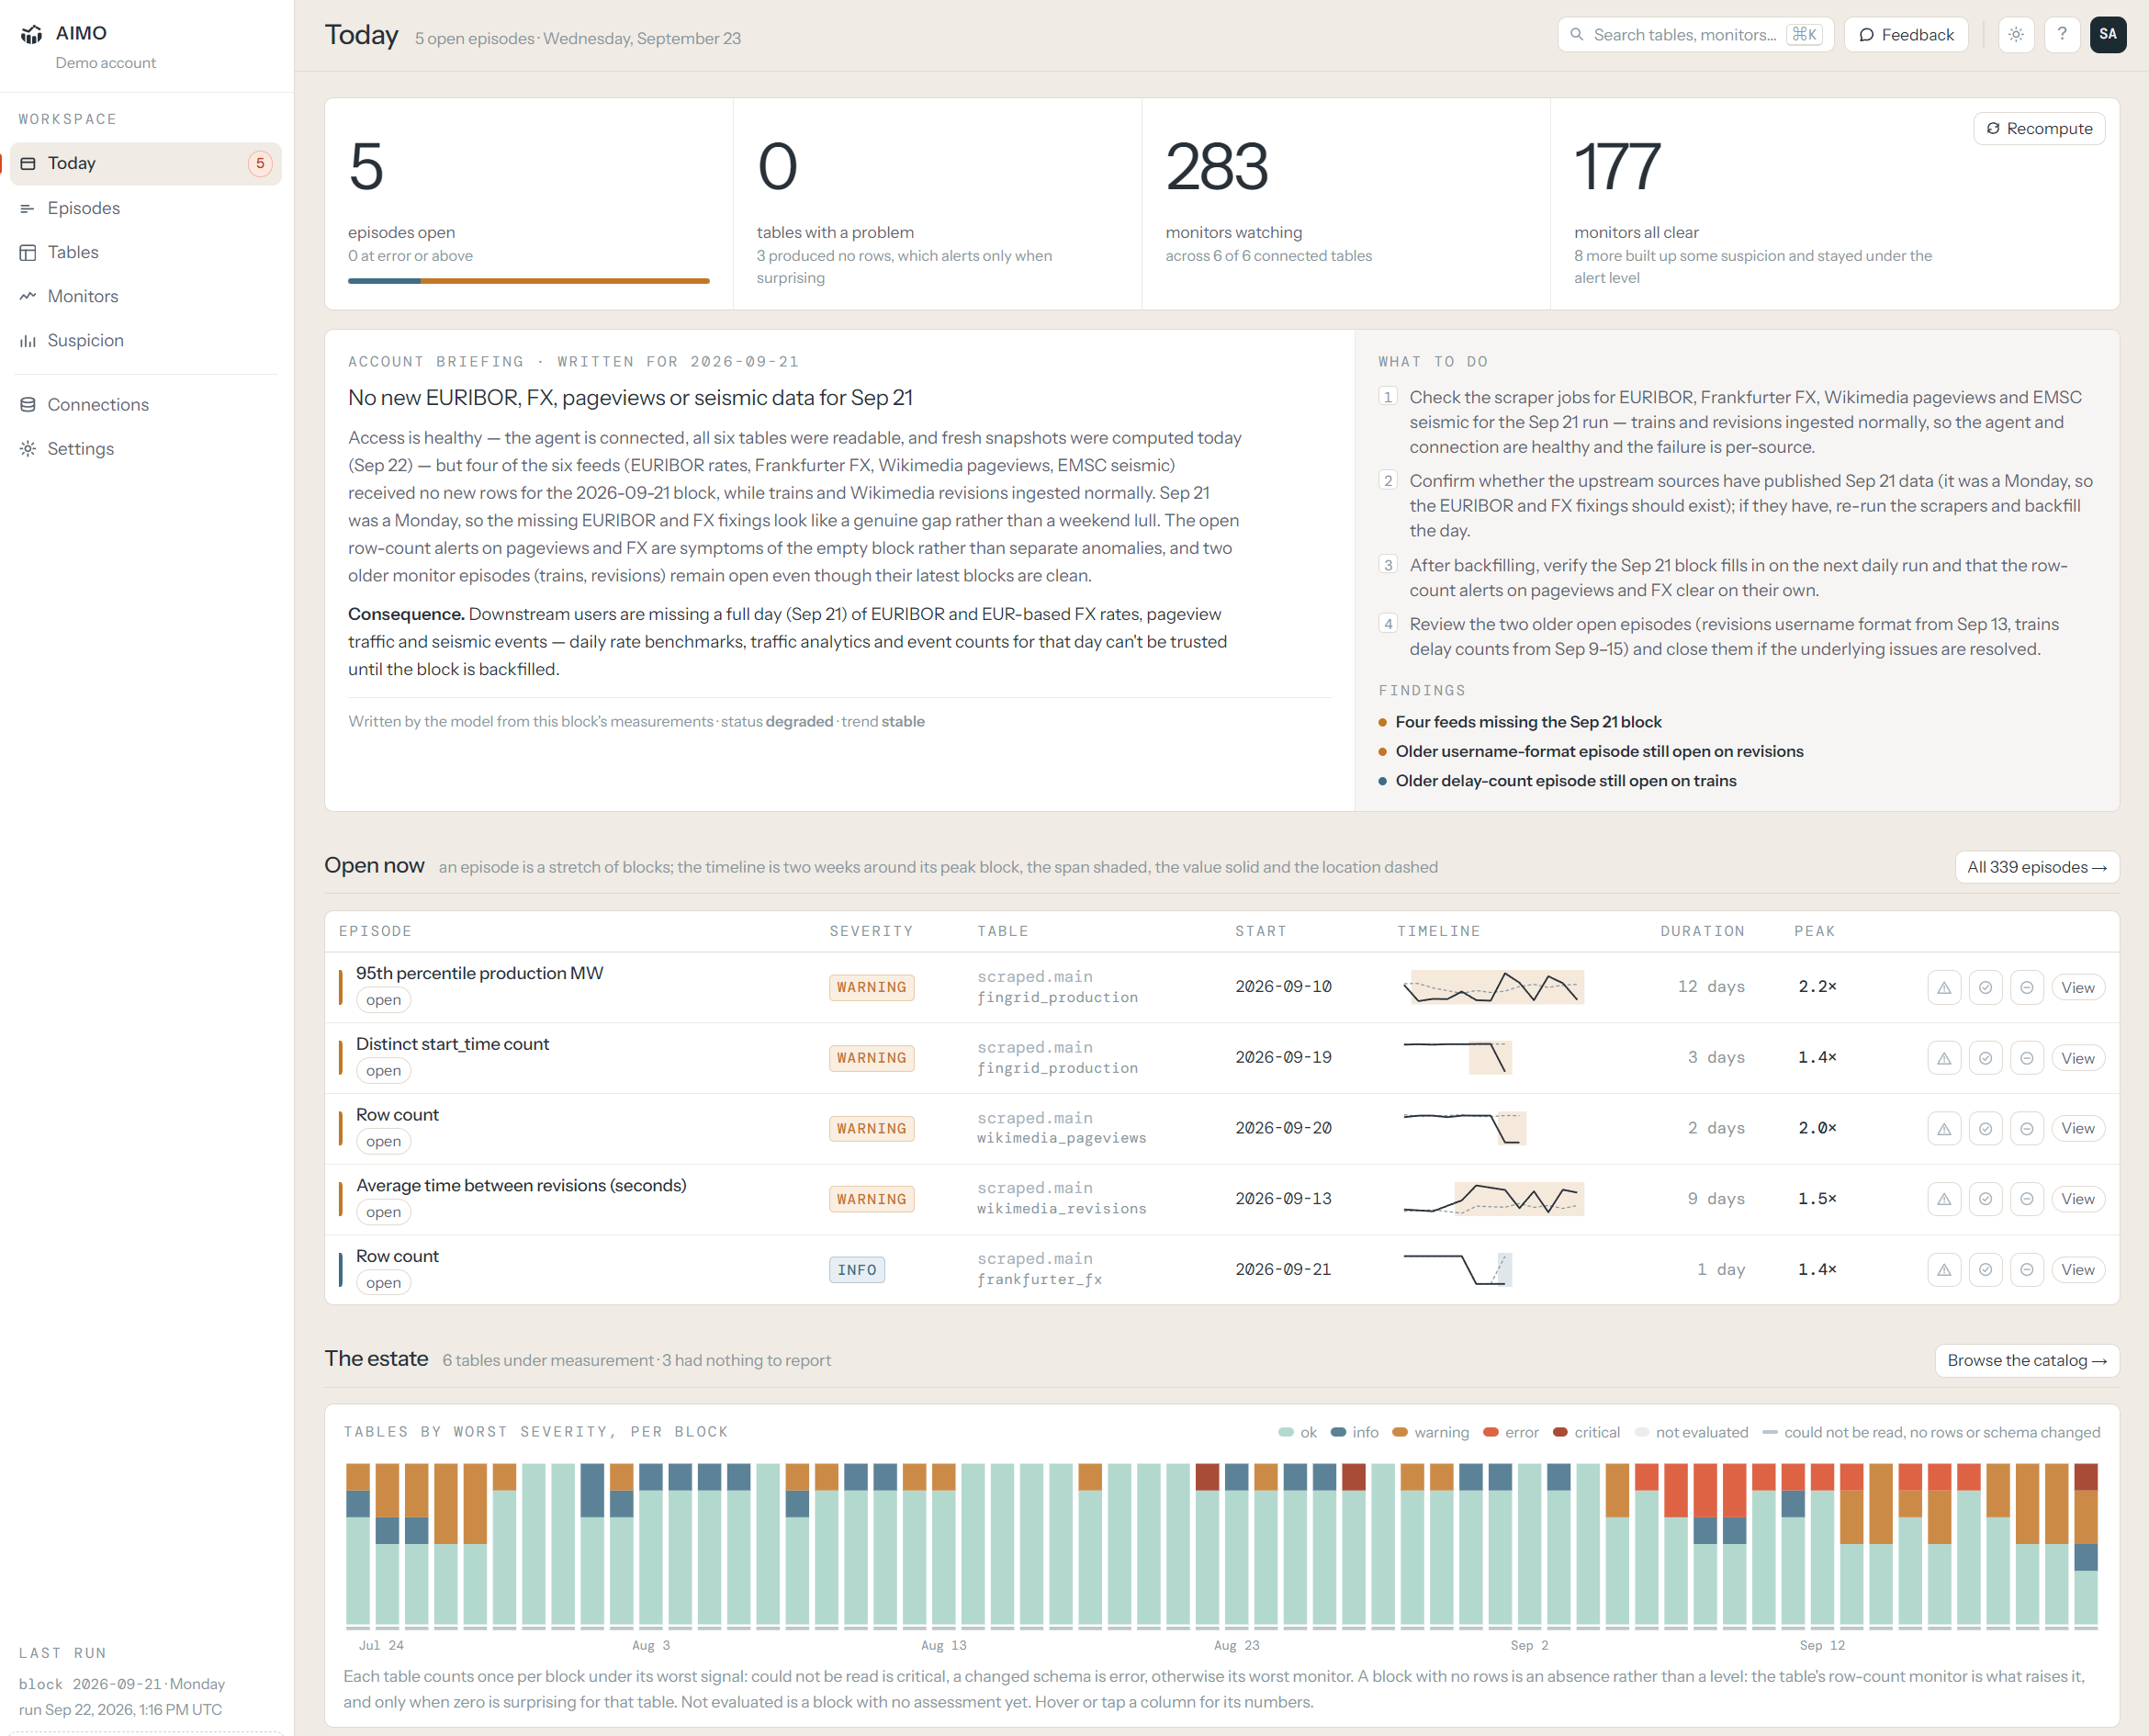
Which tables are healthy, which need attention, and the failing monitor one click away.
The approach
A table you onboard is a table that is watched.
Point AIMO at a database and it profiles the tables you select, on your own hardware. From that analysis it writes the monitors (the checks, the columns, the bounds) and explains why it chose each one.
You switch the tables on. AIMO backfills the history, rolls an expected value forward from each monitor’s own series, and judges every new reading against it. Nothing is thresholded by hand.
What you get is a standing view of your data’s health, and an alert when a table stops behaving like itself.
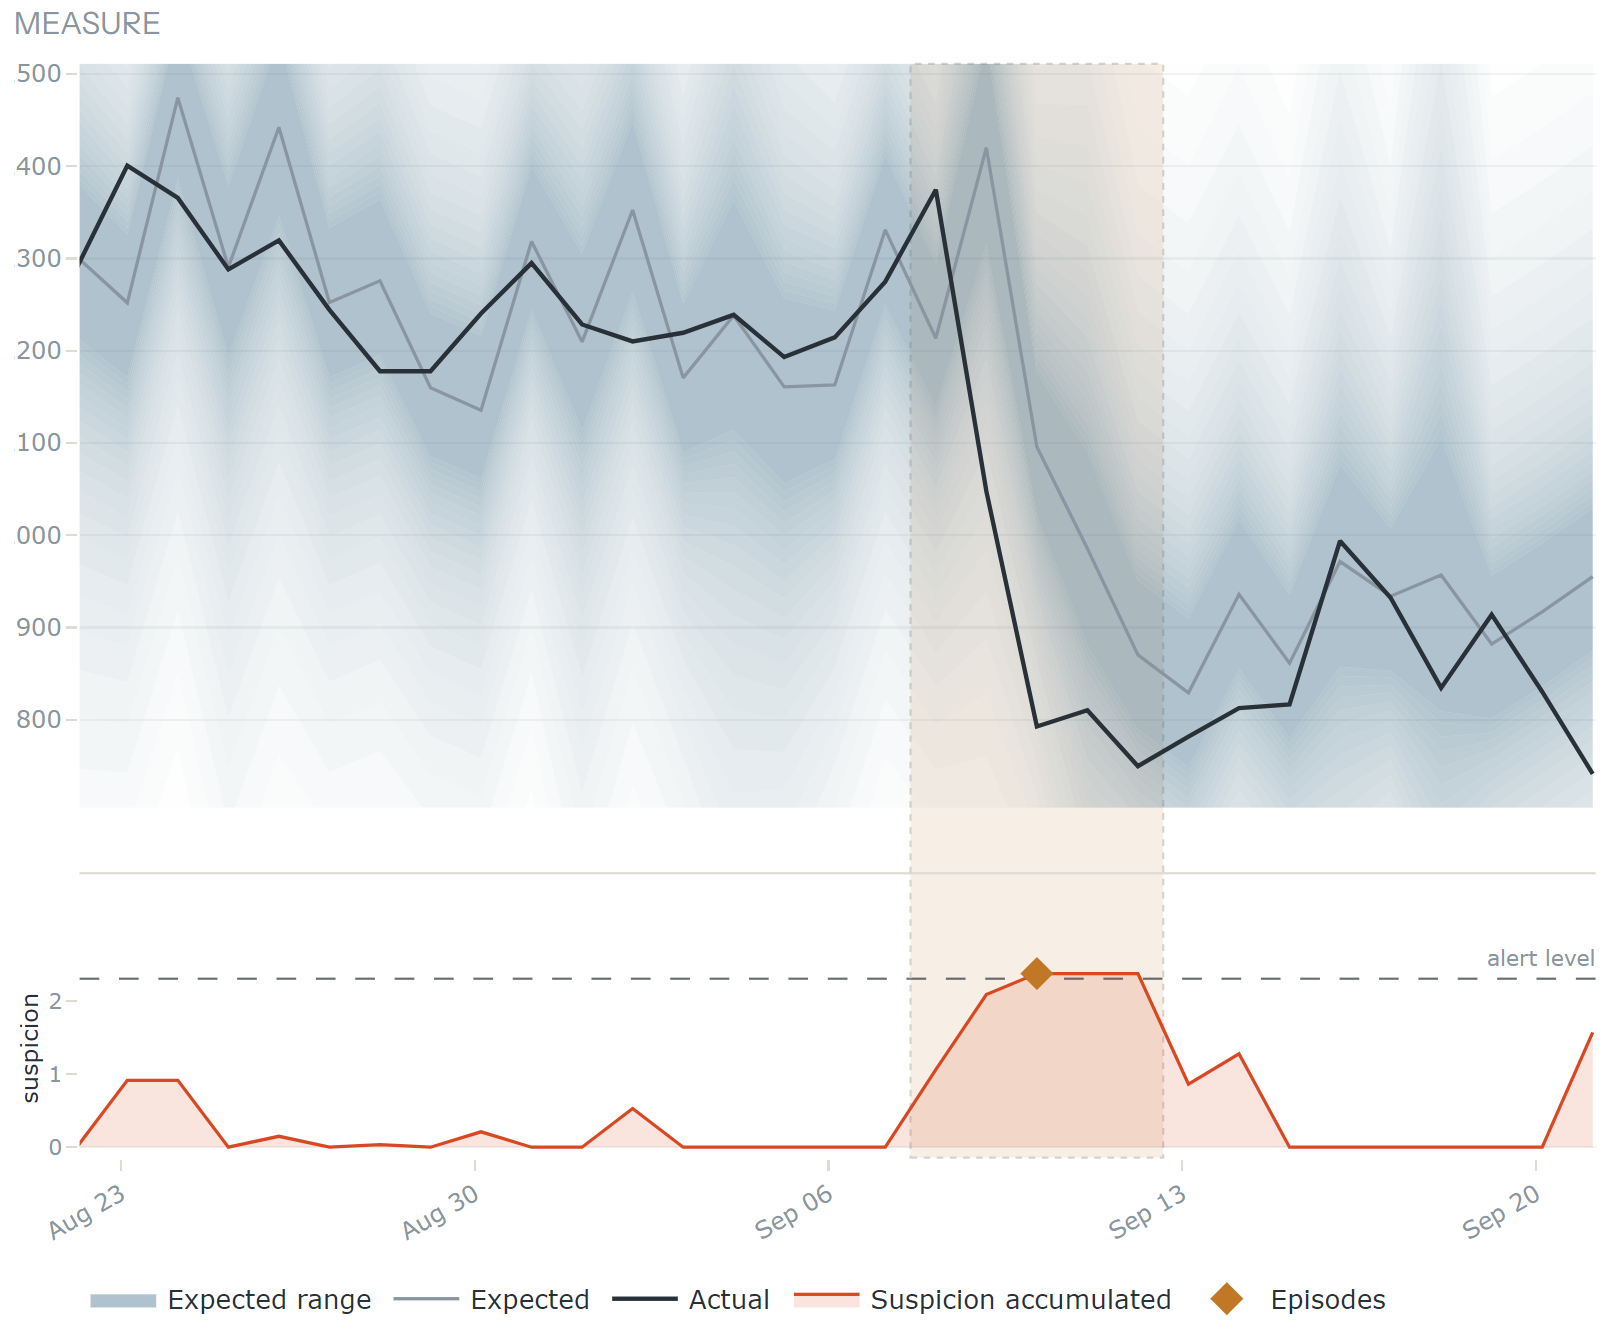
Each monitor carries the reasoning that produced it, and a band learned from its own history.
Learned outlier detection
A band of normal, not a number you guessed.
A static threshold is quick to write and brittle to keep. Set it tight and it cries wolf on every seasonal dip; set it loose and it sleeps through the drift that actually matters.
AIMO rolls an expected value forward from each monitor’s own history, rhythm and all, and judges each reading against the range that series has genuinely occupied. What arrives is an alert about a shift in behaviour, rather than a shout about one unusual row.
Signal, not volume
The hard part is staying quiet.
Any monitoring tool can find something wrong. The ones that survive contact with a real team are the ones that know when not to say so. Once people start skipping the channel you have not bought coverage, you have bought the appearance of it, and that is worse than knowing you have none. So restraint is not a setting in AIMO. It is the thing the detector is built around.
One incident, one alert
Consecutive bad blocks collapse into a single episode carrying its span and its worst point. A problem that runs for nine days is one notification, graded by how far out it actually went, not nine identical ones shouting equally loudly.
Related checks are one event
When an upstream job breaks, a dozen checks on that table go wrong at the same moment for the same reason. AIMO weighs them as one suspicion about the table, so one broken pipeline reads as one problem instead of twelve surprises.
Suspicion has to add up
A value a hair past the line raises almost no suspicion, and AIMO treats it that way. Moderate excursions build suspicion until it is genuinely conclusive, so slow drift that never trips a threshold still surfaces while the one-off graze never pages you.
Expected shapes stop being news
Weekly rhythm, monthly cycles and slow movement are absorbed into what normal means for that series. A real step change alerts while it is still news, then becomes the new baseline rather than alerting every day forever.
None of this is a filter bolted on after the fact to hide alerts you would rather not see. It is how the decision is made, which is why it buys quiet without costing coverage.
Replayed over our own demo history, 2,276 table-days across 163 monitors, the approach cut the alert count roughly eightfold, and caught a pipeline outage the simpler method slept through: after day one the old band had quietly widened far enough to accept the failure as the new normal.
Who it is for
One problem, seen from four desks.
Bad data is rarely one team’s problem. It is the same broken table arriving at four people with four different deadlines.
Data engineers
Coverage on every table you own without hand-writing a rule for each, and the first look at the load that went wrong.
Data scientists and ML teams
Assurance that the tables behind a training run held their shape, before a model learns something that was never true.
Analytics and BI leads
Confidence that the figure in the dashboard is the figure in the table, and warning the moment it stops being so.
Security and compliance
A monitoring tool that creates no new copy of your data, opens no inbound path, and comes with a signed DPA.
The difference
What a standing control looks like.
The usual approach
Traditional data quality tooling
- −Rules written by hand, one table at a time
- −Static thresholds that fire on every seasonal dip
- −Raw rows replicated into a vendor’s cloud
- −Coverage stops wherever the backlog stopped
- −A new data-processing surface for security to sign off
- −Every threshold breach becomes one more notification
With AIMO
Monitoring as a control that is simply on
- ✓Monitors generated from each table’s schema and data
- ✓A band of normal learned from that series’ own history
- ✓Rows stay put; aggregates and metadata are all that move
- ✓Every table you switch on is covered from that day on
- ✓Outbound-only agent, or fully on-prem, with a signed DPA
- ✓One incident is one alert, against a false-alarm budget you set
Data quality stops being a project somebody will get to, and becomes a control that is already running.
The boundary
Why your rows never have to move.
Most monitoring means handing a vendor a copy of your data. That is a second place for it to leak, a second jurisdiction to argue about, and a review to clear before you can even trial the thing.
AIMO inverts it. One agent runs inside your network and dials out. AIMO sends it typed jobs (analyse, calculate monitors, validate, test a connection) and it answers with counts, grouped results and schema fingerprints. There is no supported path from our cloud to your SQL port, and where policy allows nothing outbound at all, the whole platform deploys on-prem on an LLM you supply.
Capabilities
One control layer for the whole table lifecycle.
01 Monitors generated for each table
AIMO reads the schema and a statistical profile of the data, then writes the monitors: the checks, the columns to watch and the valid ranges and value sets, with its reasoning attached. Every one starts active; you switch off what you do not want, and nothing is assigned behind your back.
Each monitor is a typed, validated definition that compiles into one bounded, grouped query. Nine families cover the ground, including a custom aggregate for the KPIs and cross-column rules the structured families cannot express.
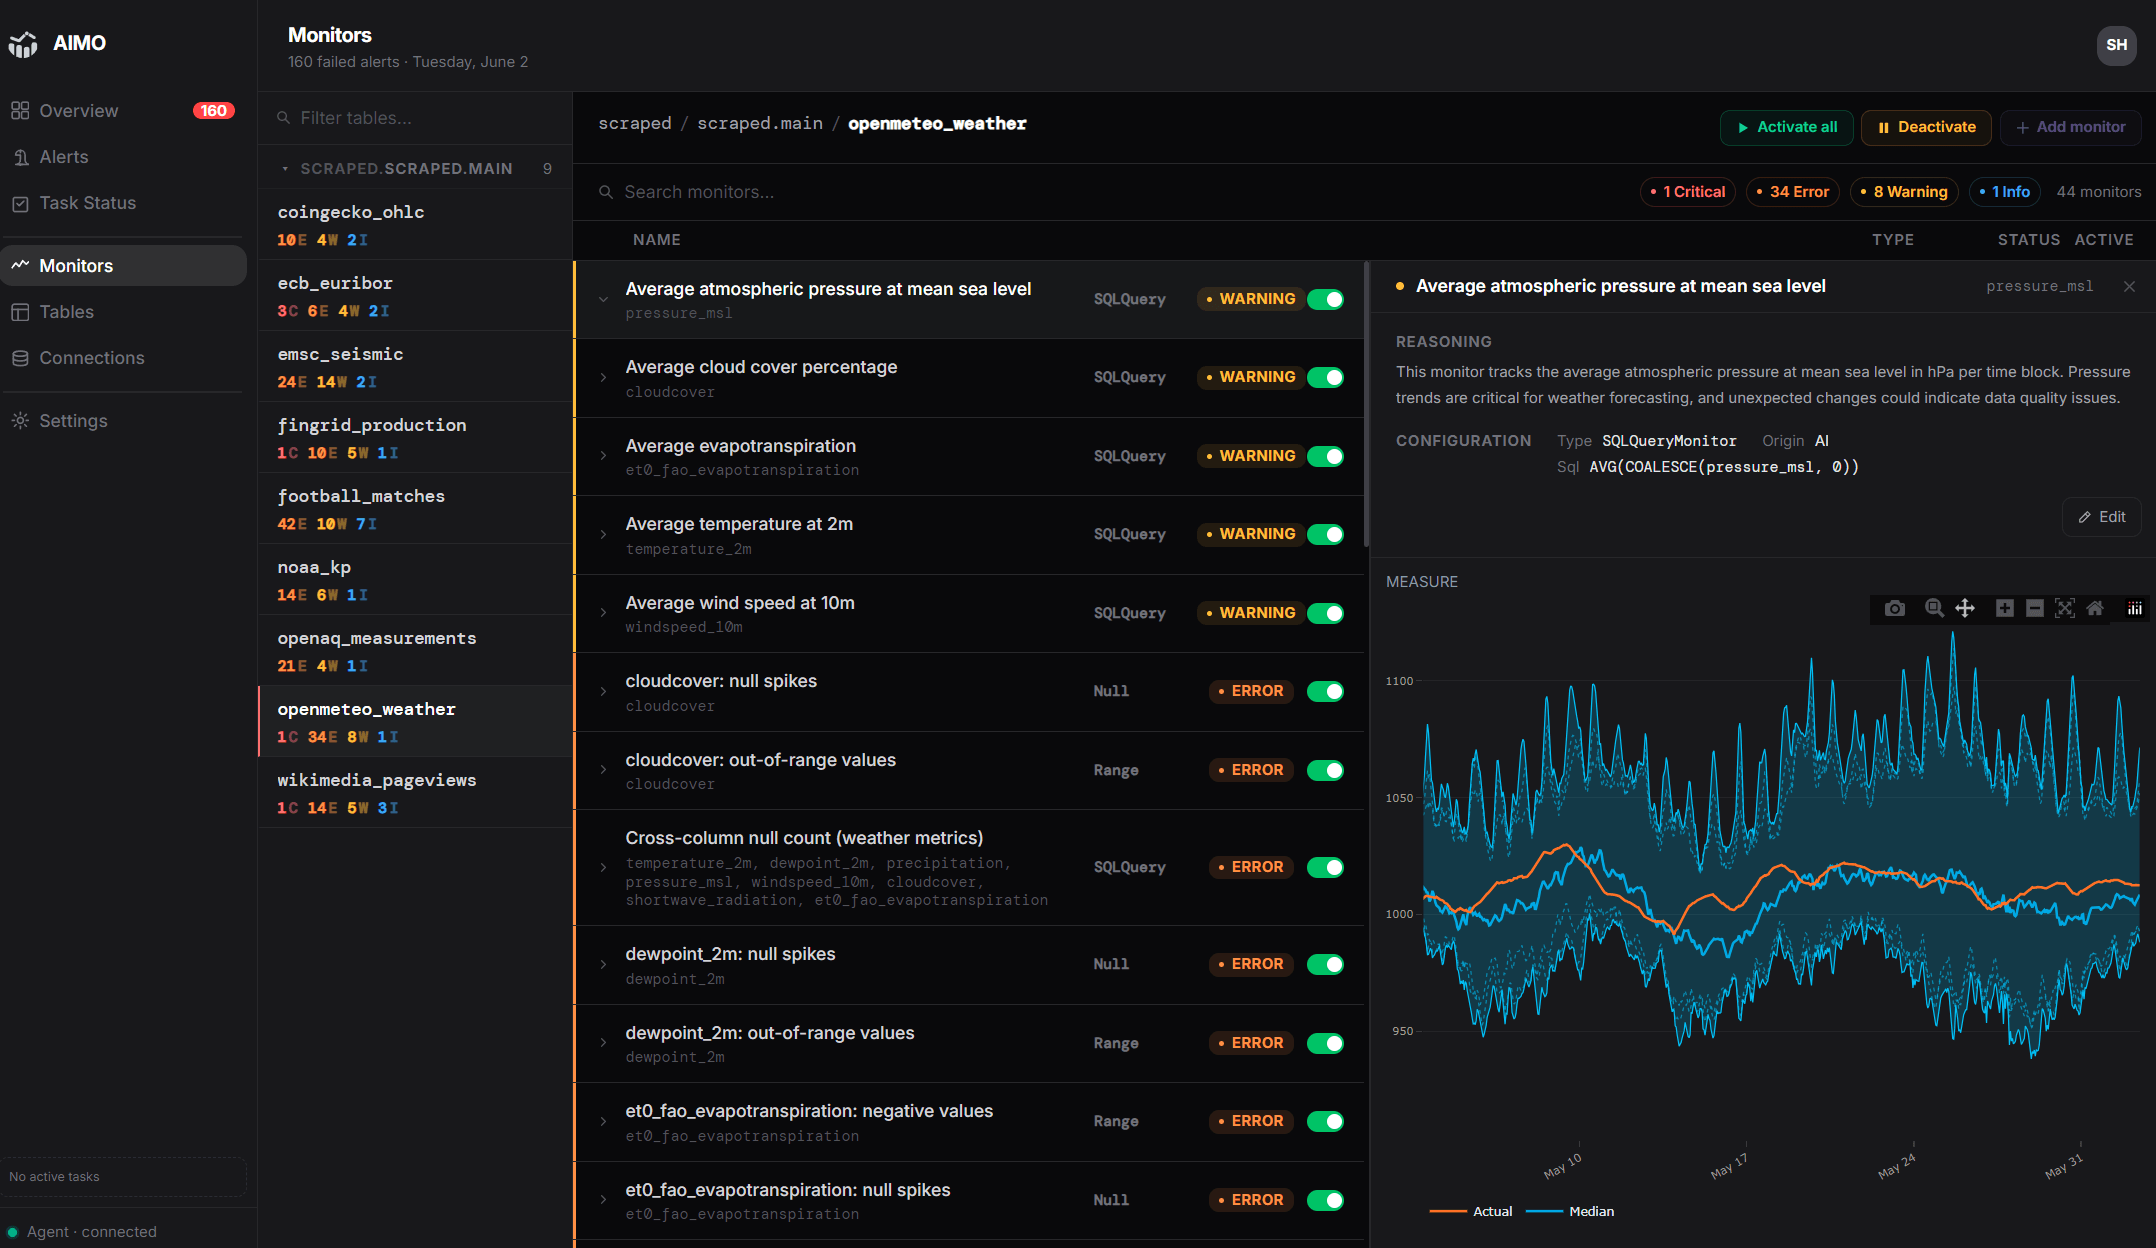
Every generated monitor for a table, each with its own series and the suspicion it carries.
02 A learned band instead of a threshold
Every monitor produces a series, and AIMO rolls forward what that particular series should read next, from its own history and rhythm. New readings build suspicion against that expectation rather than against a number somebody guessed once and never revisited.
The result is an alert about a shift in behaviour, a distribution that moved or a count that stopped arriving, instead of noise about a single odd row.
03 Schema and contract drift
Schema discovery runs when you onboard a table, and tracking continues from then on. A column added, dropped, renamed or retyped by an upstream migration shows up as a recorded change.
You find out when the contract moved, rather than when the dashboard built on it stops rendering.
04 Aggregates out, and nothing else
Profiling and monitor runs happen on the agent, beside your data. What crosses the boundary is summaries and monitor outputs: column names and types, aggregate statistics, monitor results, progress and heartbeats.
Bulk rows and PII do not. The jobs the agent will accept are a fixed set (analyse, calculate monitors, validate, test a connection), so there is no arbitrary cloud code running beside your database.
05 Alerts routed by severity
Alerts carry a severity, so the worst open problem is the one that surfaces first rather than simply the most recent. Email and Slack today, with more destinations on the way.
Acknowledging an alert resolves it without erasing it, so the record of what went wrong and when stays intact.
06 A stated limit on how much is noise
The alert budget is set in a unit that means something: how many false alarms per monitor per year you are willing to accept. Not an unlabelled slider from one to ten. You decide the noise before you accept it, once, for the whole account.
Holding that promise is harder than it sounds, because checks on one table are not independent: one broken load moves many of them together. AIMO counts suspicion in a form whose guarantee survives that correlation, so a single upstream fault cannot quietly multiply into a dozen notifications.
Security & privacy
Built for the security review.
Credentials are entered through the agent CLI, never the browser, and encrypted before they are uploaded. Database access is decrypted on the agent, beside your data, not in a browser, and never in plaintext in our API.
Data stays in your environment
The agent queries your databases from inside your own network. Only aggregates and monitor results leave, never raw rows or PII. On-prem is available too, so nothing has to leave at all.
Ciphertext at rest
Secrets are encrypted on the agent before upload, with a passphrase that never leaves your environment. We store ciphertext; the agent decrypts only to run a job.
Agent identity, not a shared secret
Each agent holds its own Ed25519 keypair and the cloud keeps only the public key. It proves possession for short-lived tokens; there is no static API password.
Typed jobs, typed monitors
Jobs deserialize into known models or are rejected. The SQL that runs on your side is compiled from validated definitions, not free-form strings in a payload.
Passwordless sign-in
Human access to the web UI uses passkeys only. There is no password to phish, reuse or leak.
EU-based and GDPR-ready
Operated from Finland. A signed Data Processing Agreement, named sub-processors and your GDPR rights are documented in Legal.
1
alert per incident, however many days and checks it spans
7
monitor families, from null checks to a custom aggregate
0
raw rows exported by routine monitoring
1
outbound session, opened by the agent; no inbound port
3
tables free for your first month
€10
per monitored table per month after that, excl. tax
Pricing
Pay per table. Nothing else.
No tiers, no seat tax, no platform fee. You are billed for the tables you actively monitor, and you add or remove them in the UI whenever you like.
Trial
Free
up to 3 tables, first month
The whole product: all nine monitor families, schema tracking, learned outlier detection and the same security model. No card needed to start.
Growth
€10
per monitored table / month, excl. tax
After the first month. Unlimited alerts, monitors as often as your pipelines need, and billing that follows the tables you keep. Remove one and it stops next cycle.
Larger organizations
On-prem
and an LLM you supply
Run the whole platform inside your own network, on your own model, across as many tables as you need, with an agreement shaped to your setup and volume rather than the per-table rate.
FAQ
Frequently asked questions.
What does initial setup look like?
register once, add your
connections in the agent CLI, then leave start running. Analyse the
database and switch on the tables that matter. Monitors are generated and
history is backfilled; that part scales with your data size.
Which databases are supported?
Who creates the monitors?
What actually leaves my network?
Can AIMO run entirely on-premises?
How do you stop it becoming noise?
How often do monitors run?
How do we scale beyond the trial?
More on the subject: the complete guide, the glossary, and the full FAQ.
From the founder
“For years I watched data teams say they really should have data quality monitoring, and never get to it, because setup took months and someone had to hand-write every check. AIMO is the tool I wished existed: it reads your tables, generates the monitors, learns what normal looks like, and never copies your data out.”
Get started
Three tables, one month, free.
Register the agent, add a connection in the CLI, onboard your tables. You get generated monitors and learned outlier detection on up to three tables for your first month, and aggregates are all that ever cross the wire.